| Back to Index |
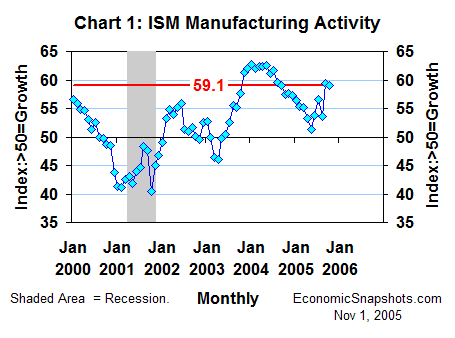
November 1, 2005 – The ISM diffusion index of U.S. manufacturing activity (the PMI) edged down by 0.3 index points to 59.1 in October – little changed from September and still signaling exceptionally strong manufacturing growth (Chart 1).

These data continue to indicate hefty gains in both production and new orders, despite a small amount of slowing in the latest month. The ISM production index fell by 1.1 index points to 62.0 in October, and the ISM new order index fell by 2.1 index points to 61.7.
According to the ISM press release, “Rising prices, and energy costs in particular, are of major concern as manufacturers are struggling to control costs.”
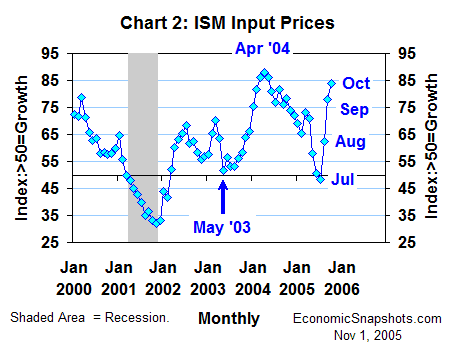
The ISM input price index shot up by 6 index points to 84.0 in October, after rising by 15.5 index points in September (Chart 2). This index has risen by a total of 35.5 index points in the last three months.

A net 68% of the manufacturers surveyed reported October increases in their input prices. In July, this net portion was a negative 3% (meaning that the portion of manufacturers reporting input price declines exceeded those reporting input price increases by 3 percentage points that month).
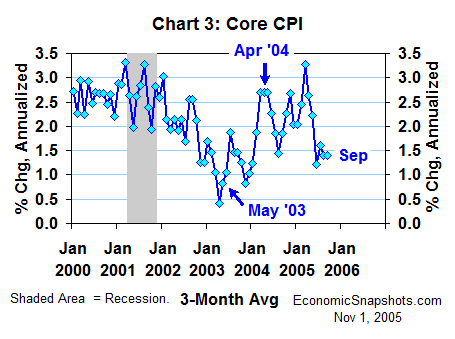
We saw a similar run up in the ISM input price index earlier in this expansion, when it rose from 51.5 in May 2003 to 88 in April 2004. That episode came and went with no lasting inflation damage – as evidenced by the reduced trend in core CPI growth since April last year (Chart 3).

One important difference this time around is that the economy seems to be closer to full capacity now. Given a continuing firm trend in final demand growth and fuller order books, there is a rising risk that firms might finally find that missing pricing power.
Suzanne Rizzo