| Back to Index |
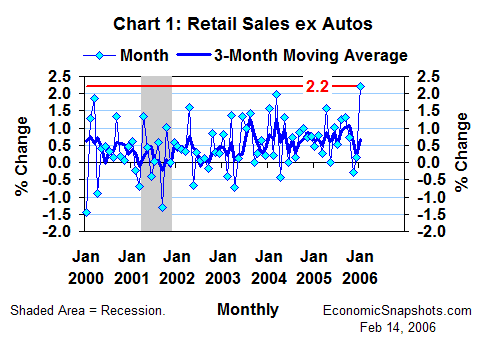
February 14, 2006 – U.S. retail sales soared by 2.3% in January after a 0.4% December rise. Checking first on the usual suspect, this extra strong January gain was not caused by auto-sector volatility. Excluding sales at motor vehicle and parts dealers, January retail sales still rose by a whopping 2.2% (+0.2% in December, Chart 1).

The strength in January non-auto retail sales appears to have been broadly based, with sales in 9 of the 12 major non-auto categories showing sharp increases in January growth.
January sales may have been temporarily boosted, across the board, by the unseasonably mild January weather (which tends to increase store traffic) and/or redemptions of Christmas gift certificates.
It remains to be seen how much of January’s nominal non-auto retail sales gain will translate into real sales growth. The increases seen in January gasoline prices suggest that we are due for another energy-led surge in the overall consumer price level in January. (The CPI report is coming next week.)
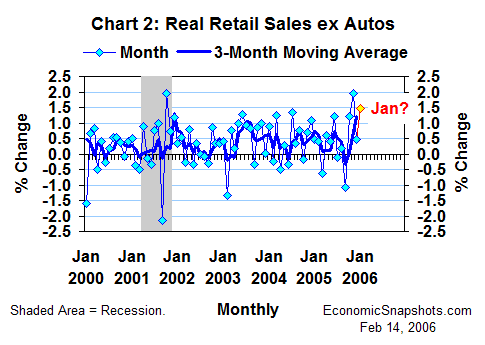
The best guess here is that consumer good prices rose by about 0.7% in January (-0.3% in December). That would put real non-auto retail sales growth at about 1.5% in January (+0.5% in December, Chart 2).

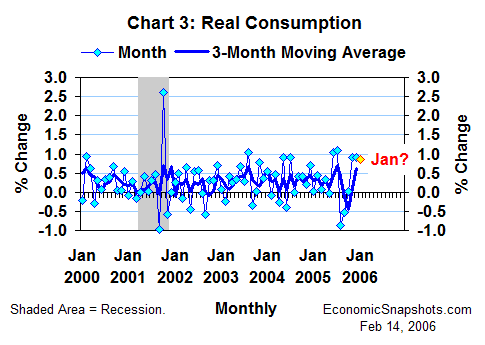
Factoring in the 2.5% increase in January light vehicle sales, allowing for a weather-related drop in consumers’ real purchases of household utility services, and assuming a continuing moderate trend in non-energy services demand, these data could be consistent with January real consumption growth of about 0.8% (Chart 3). That would mark the third straight month of rebounding consumption, after three straight months of exceptional (hurricane-related) weakness.

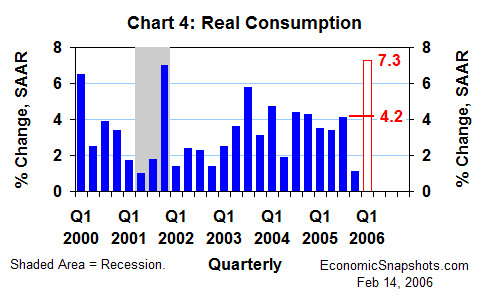
Assuming zero real consumption growth in February and March, a 0.8% January gain would push Q1 growth to a whopping 7.3% annual rate (Chart 4). Combined with Q4’s unusually low 1.1% increase, this would yield an average consumption gain of 4.2% for the last two quarters – in line with the near-4% trend that has prevailed since mid-year 2003.

Suzanne Rizzo