| Back to Index |
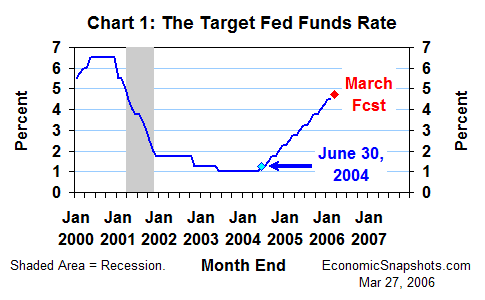
March 27, 2006 – The FOMC has already raised its target Fed funds rate by a total of 350 basis points, to 4.5%, in a steady stream of “measured” 25 basis point increments (Chart 1). There is a strong consensus for at least one more 25 basis point increase at the FOMC’s policy meeting on Monday and Tuesday this week. Beyond Tuesday, it’s a toss up whether the FOMC will tighten again or not.

According to the minutes of the FOMC’s last policy meeting in January, “…the stance of policy seemed close to where it needed to be given the current outlook”. Thus, it looks like the FOMC is about ready for a pause in its tightening “program”.
However, the FOMC also warned that it would continue to tighten if real economic growth or inflation threatened to exceed its forecast. In particular, the FOMC fears that – with the unemployment rate already relatively low – too much economic growth might lead fairly quickly to labor shortages and inflationary wage growth.
The FOMC’s January forecast calls for real GDP growth averaging about 3.5% per quarter this year (measured at an annual rate) and a “sustainable” 3% to 3.5% GDP trend in 2007. The FOMC also said it expects a rebound in Q1 GDP growth after Q4’s unusual weakness.
Real GDP rose at a 1.6% annual rate in the preliminary Q4 data. Thus, Q1 GDP growth of about 4.5% to 5.5% would yield a “sustainable” average gain of about 3% to 3.5% for these last two quarters.
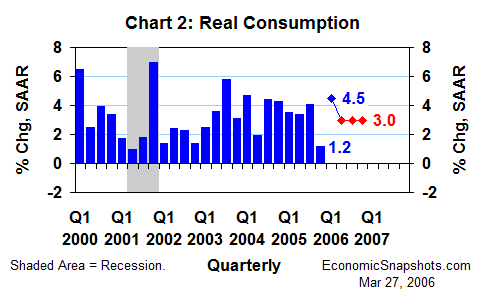
The FOMC seems to be counting on consumption, in particular, to regulate the pace of overall GDP. Based on partial data through February, real consumption growth seemed to be tracking at about a 4.5% annual rate for the first two months of Q1 – consistent with an average gain of just under 3% per quarter for Q4 and Q1 (Chart 2).

Given a 4.5% Q1 increase, consumption growth would need to fall back to a 3% trend for Q2 through Q4, to establish a “sustainable” path of 3% to 3.5% growth for 2006 as a whole. Thus, if the consumption indicators seem to be showing too much forward momentum going into Q2, the FOMC might vote to tighten again at its next policy meeting in May.
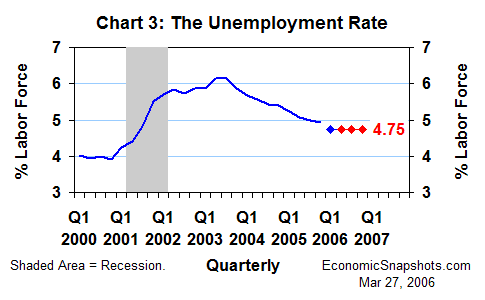
The FOMC forecast an average unemployment rate of 4.75% to 5% for the last quarter of this year. In the data released since then, the unemployment rate averaged 4.75% for the first two months of Q1, edging down from a 4.9% average for all of Q4 2005 (Chart 3). If the economy is indeed homing in on a “sustainable” trend, the unemployment rate should stop falling, soon.

Because of the high uncertainty about the unemployment rate’s “full employment” level, the FOMC seems unlikely to tighten based on the evidence of an unusually low unemployment rate, alone. As “some” FOMC members argued in January, “…developments affecting the participation rate in the labor force and the pace of growth in productivity would importantly condition prospects for employment and business cost pressures.”
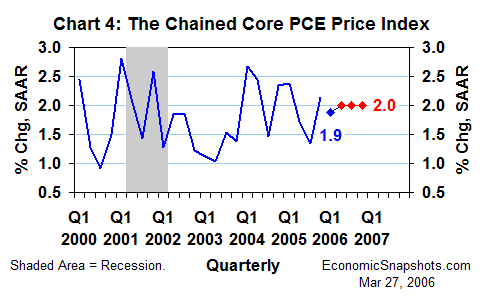
As of January, Q1 growth in the chained price index for personal consumption expenditures excluding food and energy (the chained core PCE price index) was tracking at a 1.9% annual rate – in line with the FOMC’s expectation for a 2% trend this year (Chart 4). February’s modest CPI growth suggests that core inflation remained well behaved through the second month of Q1.

As long as the core inflation indicators remain “contained”, the FOMC will probably continue to limit any future increases in its target Fed funds rate to “measured” 25 basis point increments. It would probably take clear evidence of both rising core inflation and overheating consumption growth to provoke a more aggressive Fed reaction.
Suzanne Rizzo