| Back to Index |
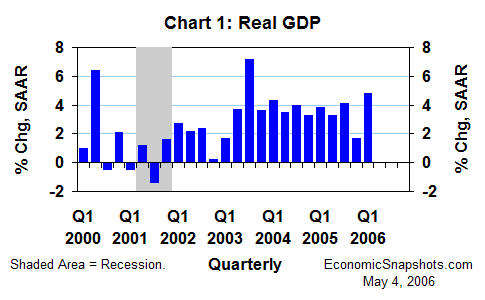
May 4, 2006 – According to data released last week, U.S. real GDP rose at a strong 4.8% annual rate in Q1 – rebounding from an exceptionally weak 1.7% Q4 increase (Chart 1).[1]
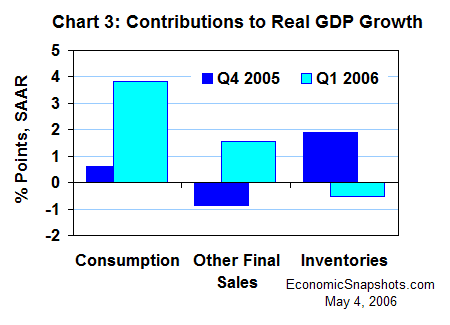
Stronger real growth in consumption, fixed investment, government purchases and net exports all contributed to faster Q1 real GDP growth – partially offset by slower Q1 real inventory growth.
However, the improvement in Q1 consumption growth – which is worth about 70% of U.S. GDP – had the largest GDP impact.
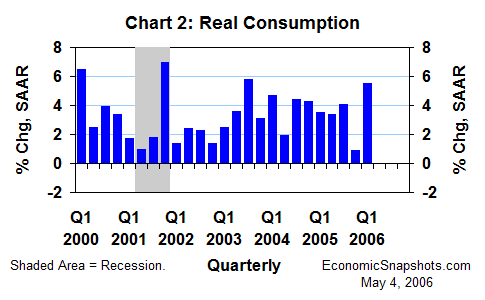
Real consumption rose at a 5.5% annual rate in Q1, after a meager 0.9% Q4 increase (Chart 2).
And, this strong Q1 consumption gain contributed a big 3.8 percentage points to Q1 real GDP growth (+0.6 percentage points in Q4, Chart 3).
However, according to the monthly data, the trend in consumption growth has slowed in recent months (Chart 4).
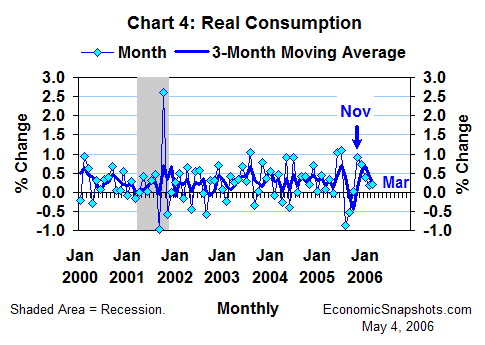
Real consumption growth averaged 0.2% per month for the three months of Q1 (about a 3% annual rate), compared to 0.6% per month (nearly a 7% annual rate) for the three months of Q4.
If monthly consumption growth were to continue at 0.2% per month from April through June, quarterly consumption growth would slow by about 2.5 percentage points to about a 3% annual rate in Q2. All else the same, that would reduce Q2 real GDP growth by about 2 percentage points (compared to Q1) – putting Q2 real GDP growth at about a 3% annual rate.
Suzanne Rizzo