| Back to Index |
July 9, 2006 – According to Friday’s data release, U.S. payroll employment rose by a sluggish 121K in June (Chart 1) after edging up by a revised 92K in May (originally +75K).[1] Revisions added a net 3K to the prior two months’ payroll growth.
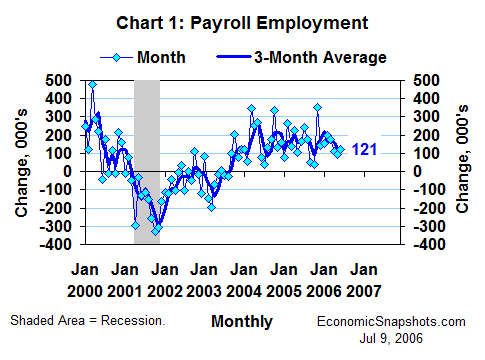
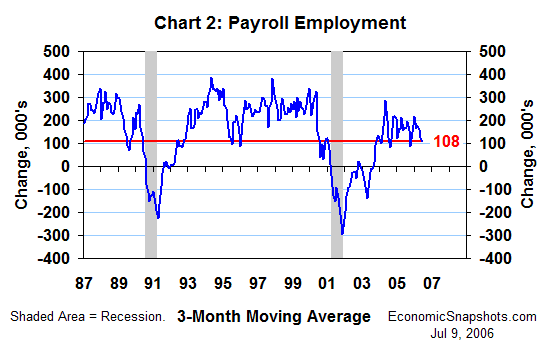
Payroll jobs rose by an average of 108K per month for the three months through June. That’s only about half the recent peak of 218K per month for the three months through January (Chart 2).
Nevertheless, payrolls still seemed to be on a rising trend in June. We would typically see a much sharper slowing in job growth if the economy were falling into a recession. Further, as of June, this three month trend had yet to move outside of the (admittedly broad) 82K to 218K range that has prevailed for the last 25 months.
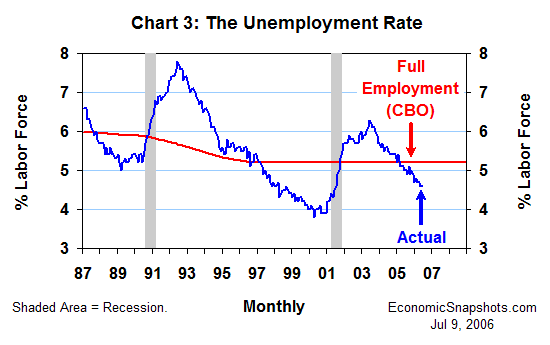
In contrast to this sluggish payroll employment growth, the unemployment rate was unchanged at a relatively low 4.6% in June – still suggesting a relatively tight labor market (Chart 3). As in May, the June unemployment rate was 0.6 percentage points below the Congressional Budget Office’s estimate of its full employment level.
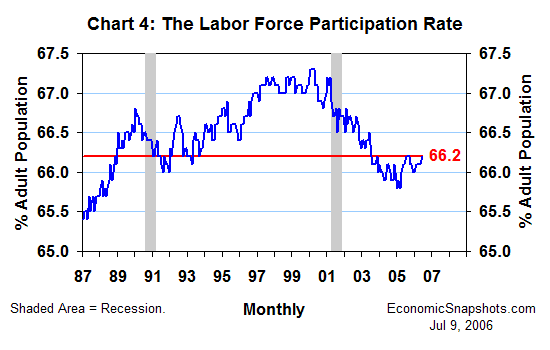
However, the persistent lack of a convincing cyclical recovery in labor force participation during this expansion continues to suggest that the unemployment rate might be understating the true size of the economy’s labor reserves. The labor force participation rate rose by 0.1 percentage points to 66.2% in June, but remained in the same 66% to 66.2% range that has prevailed since April last year (Chart 4).
Average hourly earnings shot up by 0.5% in June after a brief slowing (to +0.1%) in May. These earnings rose by 3.9% in June, compared to the same month last year (Chart 5). That's 1.2 percentage points more growth than we saw in the twelve months through June last year.
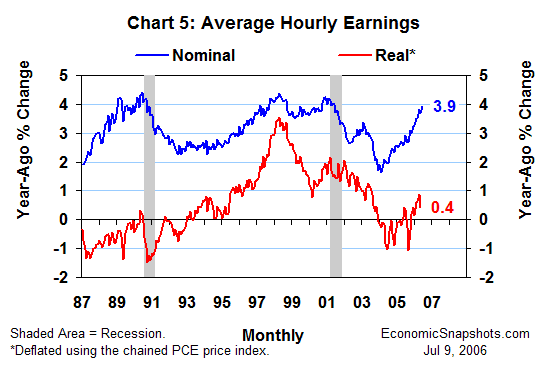
Through May, however, virtually all of this nominal earnings growth was eaten up by rising prices (especially higher energy prices). Real average hourly earnings rose by just 0.4% in the twelve months through May.
It remains debatable whether a stronger trend in earnings growth would necessarily cause more inflation. The ongoing boom in corporate profits (supported by a firm trend in labor productivity growth) suggests that firms can easily afford to pay higher wages without raising their prices. According to the BEA's latest estimates, real corporate profits from current production rose by 24.6% in the four quarters through Q1. And, for domestic, non-financial corporations, the comparable increase was 31.2%.
Bottom line: These data have yet to show clear evidence of any major new developments on the labor market front.
Suzanne Rizzo