| Back to Index |
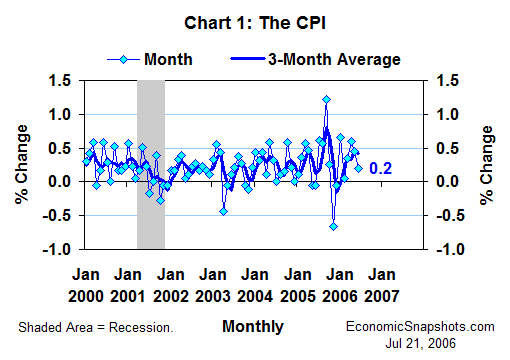
July 21, 2006 – According to Wednesday’s data release, the U.S. Consumer Price Index (CPI) rose by 0.2% in June after a 0.4% increase in May (Chart 1).
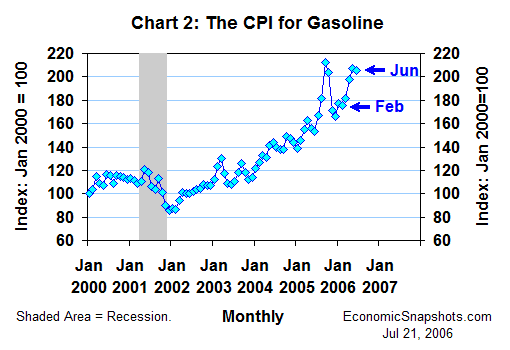
Consumer energy prices fell by 0.9% in June (+2.4% in May), more than accounting for the slowing in June CPI growth. However, the CPI’s energy component rose by a total of 7.8% in the three months through May. June’s decline left most of that earlier run up intact.
This cumulative increase in energy prices was concentrated in gasoline prices. The CPI for gasoline fell by 1% in June, but rose by a total of 18.2% in the three months through May (Chart 2). (In the weekly data, retail gasoline prices more than reversed their June decline in the first half of July.)
In contrast to gasoline, home fuel and utility costs fell for the fifth straight month in June, with declines averaging 0.8% per month.
Consumer food prices rose by 0.3% in June after rising by 0.1% in May.
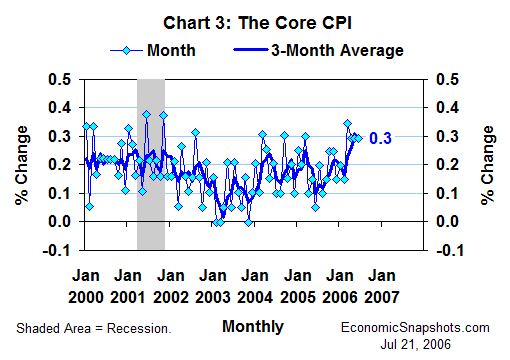
More remarkably, the closely-watched core CPI (excluding food and energy prices) rose by a firm 0.3% for the fourth straight month, in June (Chart 3).
For the three months through June, core CPI growth averaged a 3.6% annual rate (Chart 4). That’s 0.2 percentage points below its average for the three months through May, but still a big 1.6 percentage points higher than the three months through February (when growth averaged 2%).
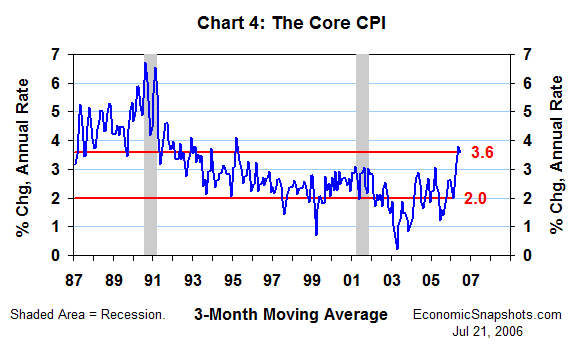
In both of the last two months, this three-month trend in core CPI growth has been at its highest in over a decade.
Shelter costs accounted for about one third of the February-June acceleration in the core CPI trend. The CPI’s shelter index rose at a 5% annual rate in the three months through June, compared to a 3% increase in the three months through February.
At least part of this pick up in shelter costs seems to be a temporary development, reflecting a tendency for the CPI’s estimates of homeowners’ equivalent rent to move in the opposite direction from home fuel and utility costs.[1]
Excluding shelter, the core CPI rose at a 2.5% average annual rate for the three months through June – about a percentage point less than the total core CPI (Chart 5).
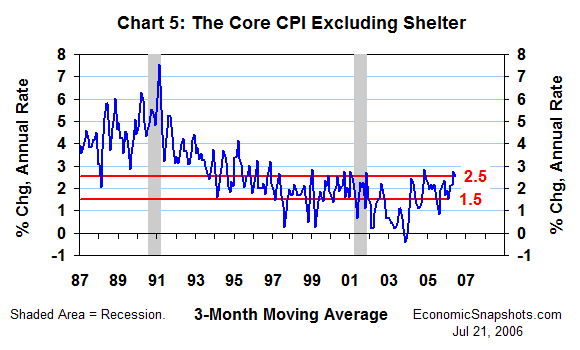
With or without shelter, core inflation has still accelerated in recent months. As of June, the three-month trend in the core CPI excluding shelter was a percentage point higher than its February low of 1.5%.
Bottom line: sustained high gasoline prices and a continuing firm trend in core CPI growth in June.
Suzanne Rizzo