| Back to Index |
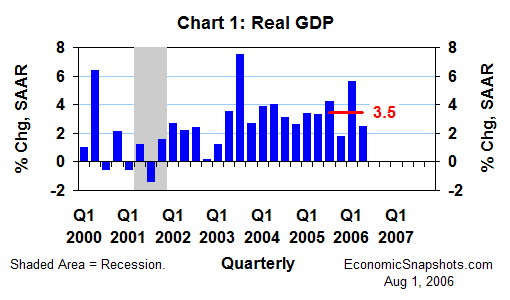
August 1, 2006 – According to Friday’s data release, U.S. real GDP rose at a modest 2.5% annual rate in Q2 after an extra-strong 5.6% gain in Q1 (Chart 1).[1]

Although volatile, real GDP growth averaged a reasonably sturdy 3.5% annual rate for the four quarters through Q2 – about in line with the FOMC’s view of a “sustainable” pace. (That’s presumably about 3% to 3.5%).
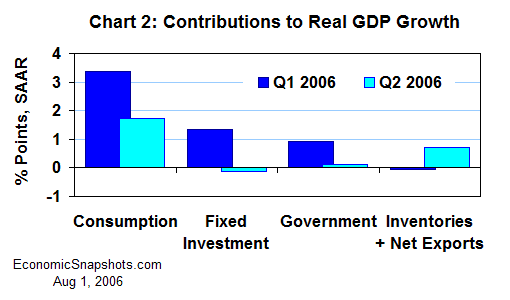
The slowing in Q2 real GDP growth was broadly based. Among the major GDP components (consumption, fixed investment, inventory investment, government spending and net exports), only inventories and net exports contributed more to Q2 real GDP growth than they did in Q1 (Chart 2).

Real consumption rose at a 2.5% annual rate in Q2, only about half as strong as Q1’s 4.8% increase. Reflecting this slowing, consumers’ contribution to real GDP growth roughly halved in Q2, falling by 1.6 percentage points (pp) to 1.7 pp.
Real fixed investment (businesses’ equipment & software purchases plus residential and non-residential construction) edged down at a 0.7% annual rate in Q2 after rising by 8.2% in Q1. Fixed investment’s contribution to real GDP growth fell by 1.5 pp to –0.1 pp in Q2.
Real government spending growth slowed to a 0.6% annual rate in Q2 after rising by 4.9% in Q1. That reduced government’s contribution to real GDP growth by 0.8 pp to 0.1 pp in Q2.
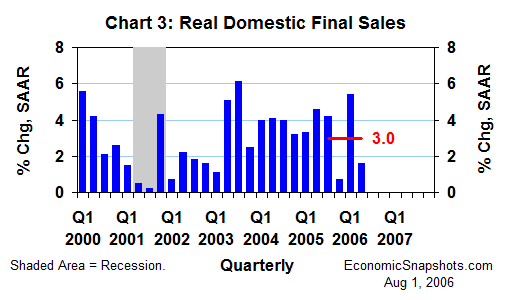
Putting these pieces together, real domestic final sales growth (consumption plus total fixed investment plus government spending) slowed to a meager 1.6% annual rate in Q2 after a big 5.4% increase in Q1 (Chart 3). This accounted for 3.9 pp of the total 3.1 pp slowing in Q2 real GDP growth.

Despite this Q2 slowing, real domestic final sales growth averaged a reasonably healthy 3% annual rate for the last four quarters.
Partially offsetting the Q2 weakness in domestic final sales, real private inventories rose at a $52.6B annual rate in Q2 (measured in chained 2000 dollars), compared to a Q1 increase of $41.2B. This $11.4B increase in Q2 inventory growth added 0.4 pp to real GDP growth, up from a zero contribution in Q1.
Despite their faster Q2 growth, inventory levels remained historically lean in Q2, relative to final sales.
Real net exports rose by $9.5B to an annualized deficit of $627.1B in Q2. This improvement in the foreign trade balance added another 0.4 pp to Q2 real GDP growth. Like inventories, net exports’ contribution to real GDP growth was also zero in Q1.
Bottom line: Real GDP growth slowed sharply in Q2, moving back in line with the FOMC’s ideal of a “sustainable” trend in economic growth. It remains an open issue whether growth will continue on a "sustainable" path in Q3.
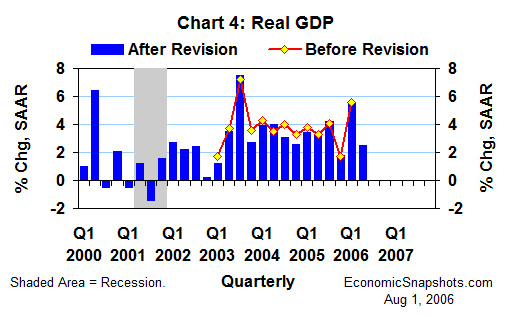
Note: Friday’s GDP release included the BEA’s regular annual revisions, beginning in Q1 2003 (Chart 4). For the three years through Q4 2005, these revisions reduced average quarterly real GDP growth by 0.3 percentage points to a 3.4% annual rate. Q1 2006 real GDP growth survived these revisions intact.

Suzanne Rizzo