| Back to Index |
August 6, 2006 – U.S. payroll employment (released Friday) rose by a modest 113K in July (Chart 1). This followed a revised June increase of 124K (originally +121K). Revisions added a total of 11K to the prior two months’ payroll growth.
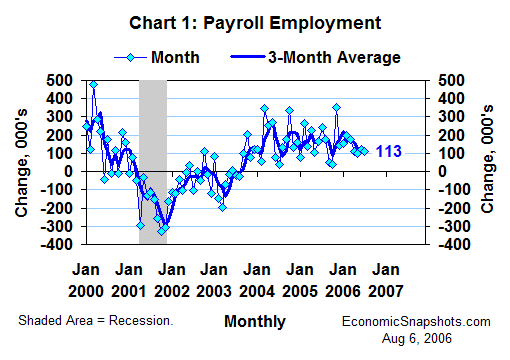
Payroll growth has remained in a modest 100K to 125K range for the last four months. We haven’t seen such persistently slow job growth since June-to-September 2004.
The good news is that payrolls were still growing in July. That’s a strong indication that, as of July, the economy had probably not fallen over the brink, into a recession.
The unemployment rate rose by 0.2 percentage points to 4.8% in July (Chart 2). This was the unemployment rate’s first significant increase since its hurricane-driven rise in September 2005. There weren’t any obvious “special factors” to blame for July’s increase.
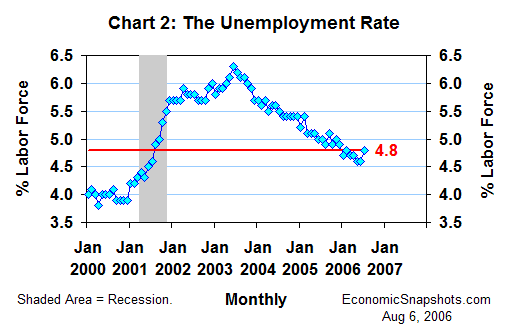
The FOMC’s consensus economic forecast (released last month) calls for the unemployment rate to average between 4-3/4% and 5% in Q4 this year. July’s increase seems to be in line with that expectation.
Even after July’s increase, the unemployment rate was still 0.4 percentage points below the Congressional Budget Office’s estimate of its “full employment” level – still suggesting a relatively tight labor market.
The labor force participation rate was unchanged at 66.2% in July – a half percentage point below its level at the trough of the last recession. The lack of a cyclical recovery in labor force participation continues to suggest that the unemployment rate might be understating the true size of the economy’s untapped labor pool.
Average hourly earnings rose by 0.4% for the second straight month in July – an annualized increase of 5.2% (Chart 3).
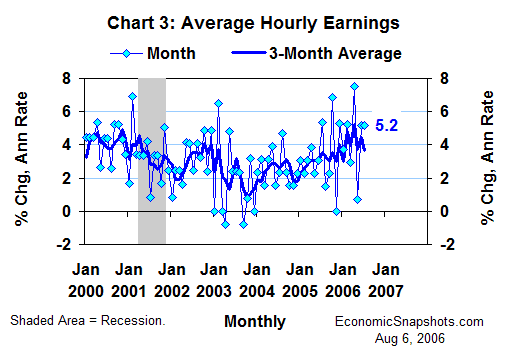
Growth in these earnings averaged a 3.7% annual rate for the three months through July, in line with their 3.8% trend for the last twelve months.
Through June, however, inflation continued to match or exceed these relatively strong nominal earnings gains – suggesting a flat or falling real earnings trend (Chart 4).
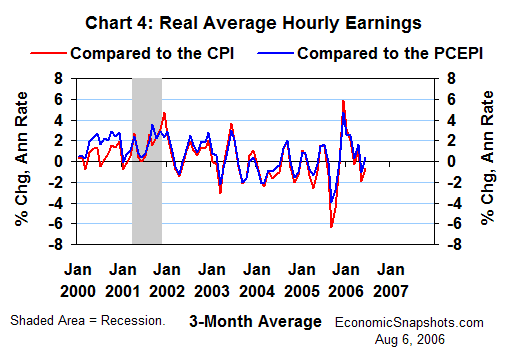
For the three months through June, the chained price index for personal consumption expenditures (the PCEPI) rose at a 4.1% average annual rate, and CPI growth averaged 5.1%. (Nominal average hourly earnings rose at a 4.4% average annual rate during the same time frame.)
Bottom line: The combination of slower payroll job growth and the rising July unemployment rate should help to persuade FOMC members to vote for a pause in their current tightening “program” at their pending policy meeting on Tuesday.
Suzanne Rizzo