| Back to Index |
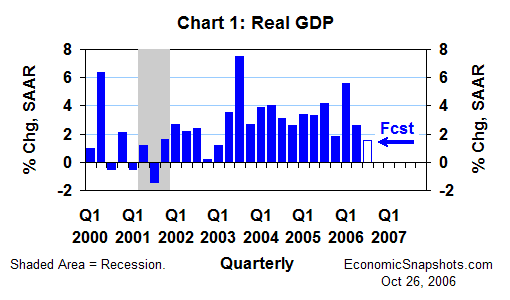
October 26, 2006 – U.S. real GDP growth (coming Friday) probably slowed to about a 1.6% annual rate in Q3, after 2.6% gain in Q2 (Chart 1).

This Q3 GDP slowdown should be concentrated primarily in foreign trade. Real domestic final demand growth (consumption plus fixed investment plus government spending) probably firmed to about a 3% annual rate in Q3 (+1.6% in Q2).
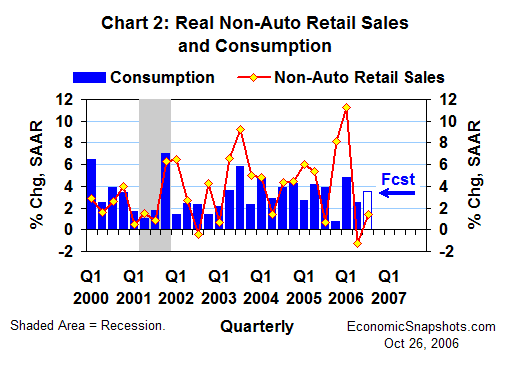
In the consumption indicators, real non-auto retail sales rose at a 1.4% annual rate in Q3 after falling by 1.3% in Q2 (Chart 2).

At the same time, car and light truck sales rose by 0.3M units to a 16.6M annual rate in Q3, reversing half of their Q2 decline.
Partially offsetting this pickup in Q3 demand for consumer goods, growth in consumers’ real services purchases slowed to just over a 3% annual rate in the first two months of Q3 (+3.7% for all of Q2).
Assuming steady trend in September services growth, real consumption probably rose at about a 3.6% annual rate in Q3 (+2.6% in Q2).
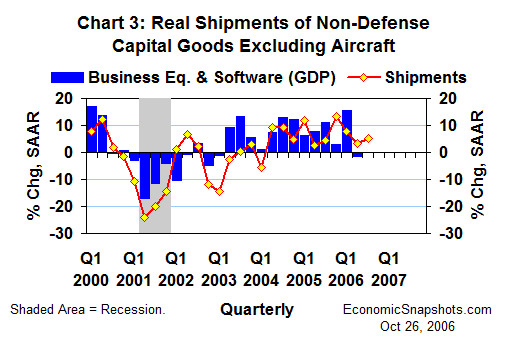
In the investment data, real non-defense capital good shipments excluding aircraft rose at 5.3% annual rate in Q3 (+3.2% in Q2, Chart 3). With this improvement, we might see some revival in real business equipment & software investment growth in Q3. (In Q2, these purchases fell at a 1.4% annual rate.)

Monthly data through August suggest that real residential fixed investment may have plunged at a 17% annual rate in Q3, after an 11.1% decline in Q2. At the same time, however, real non-residential construction spending was on track to more than match Q2’s stellar 20.3% annual rate of growth.
Adding these pieces together, total real fixed investment was probably about unchanged in Q3, after falling at a 1.6% annual rate in Q2.
Based on monthly data through August, real net exports might have fallen by a big $31B in Q3 (to a deficit of about $655B). That would slice over a percentage point from Q3 real GDP growth.
Also based on two months’ data, a less dramatic slowing in Q3 real inventory growth might have shaved an additional 0.2 percentage points or so from real GDP growth.
In Q2, increases of about $12.5B in both real net exports and real inventory growth each added 0.4 percentage points to real GDP growth.
Real government spending (always a wildcard) slowed to an unusually weak 0.8% annual rate in Q2. This forecast assumes somewhat stronger government growth in Q3.
Suzanne Rizzo