| Back to Index |
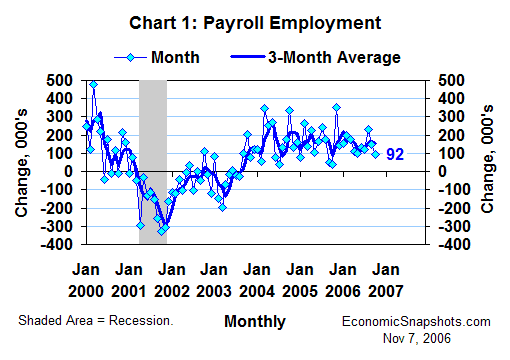
November 7, 2006 – In the data released last week, U.S. payroll employment was little changed in October, edging up by a mere 92K (Chart 1). This increase was too small to qualify as statistically significant at the 90% confidence level.[1]

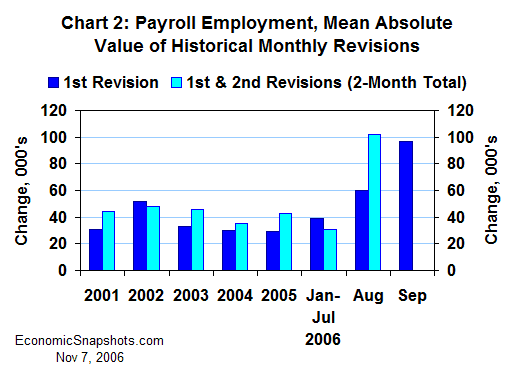
Tempering the lack of October job growth, these data also included unusually large upward revisions in payroll jobs for both of the prior two months (Chart 2).

Payrolls rose by a revised 148K in September. That’s 97K more job growth than the meager 51K September rise reported last month.
In addition, August payroll growth was revised to +230K. That’s 42K more job growth than last month’s report of a 188K August increase. Further, compared to the 128K gain reported two months ago, it now appears that the economy created 102K more jobs in August.
These revisions were roughly 2.5 to 3 times larger than the historical norms for the past five years.[2] The BLS said these changes were caused by the inclusion of new data from late surveys (the usual source). The overall survey response rates for September and August were “well within normal ranges”. The later surveys simply showed stronger payroll job growth than the earlier surveys for both of these months.
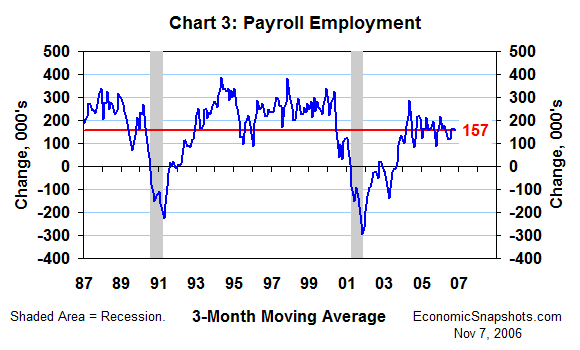
As revised, payroll employment growth averaged 157K per month for the three months through October (Chart 3). That’s not an outstandingly strong trend, but it is strong enough to suggest that the economy continued to grow at a moderate pace through October.

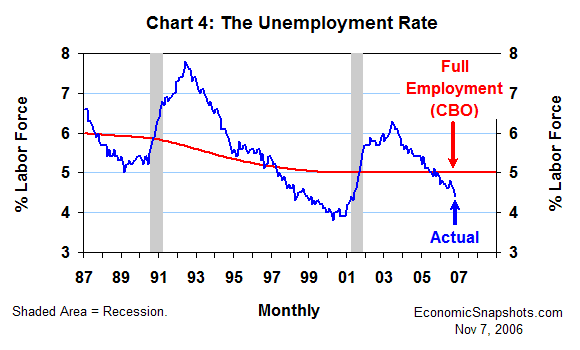
The unemployment rate edged down by 0.2 percentage points to 4.4% in October (Chart 4). As of October, the unemployment rate was 0.6 percentage points below the Congressional Budget Office’s 5% estimate of its “full-employment” level, indicating a relatively “tight” labor supply.

In contrast, October earnings growth continued on a relatively steady course. Average hourly earnings rose at a 4.4% annual rate in October – somewhat faster than September’s 2.9% increase, but still in line with the general trend of about 4% that has prevailed since the start of this year.
Suzanne Rizzo