
| Back to Index |
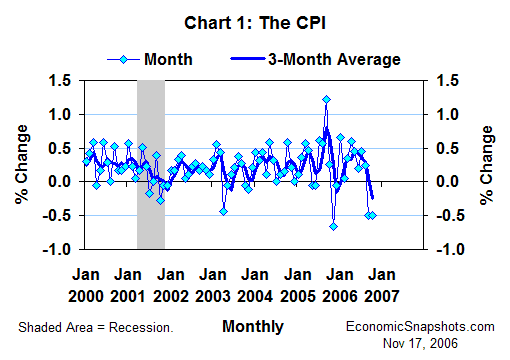
November 17, 2006 – According to yesterday’s data release, the seasonally-adjusted U.S. Consumer Price Index (CPI) fell by 0.5% in October, matching and extending September’s 0.5% drop (Chart 1). Falling energy prices more than accounted for both months’ CPI declines.
Consumer energy prices fell by 7% in October after a September decrease of 7.2% (Chart 2). These two reductions more than reversed the large run up in energy prices during the first eight months of this year.
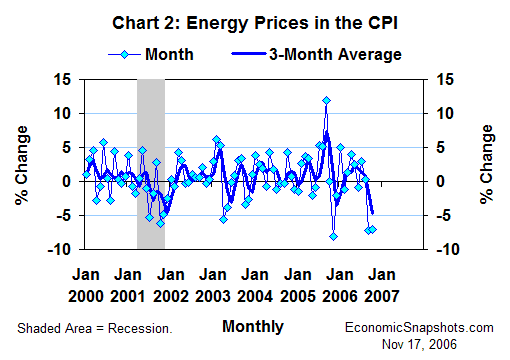
Dominating these total energy price declines, gasoline prices fell by 11.1% in October after a September decrease of 13.5%. This falloff in gasoline prices, alone, reduced October CPI growth by a half percentage point. In addition, household fuel and utility prices fell by 2.2% in October (+0.7% in September), trimming another 0.1 percentage point from October CPI growth.
In the weekly data, retail gasoline prices edged down a bit further in the first half of November (compared to their October average), but seemed to be shaping up for a far less visible role in November CPI growth.
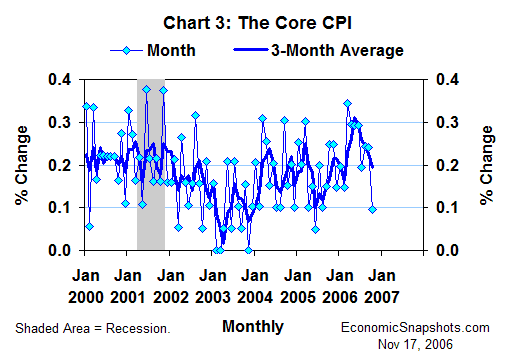
Excluding energy, the CPI rose by 0.1% in October (+0.2% in September). Growth in the closely-watched core CPI (excluding food and energy prices) also slowed to 0.1% in October (+0.2% in September, Chart 3). This was the smallest increase in the core CPI since August 2005 (when it also rose by 0.1%).
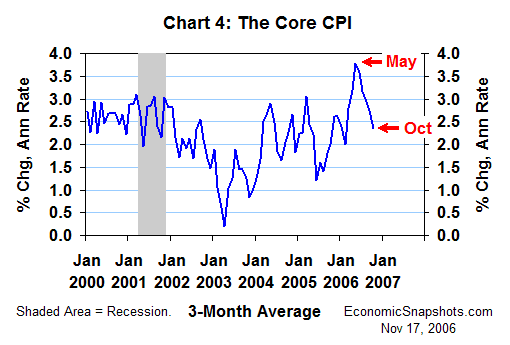
For the three months through October, the core CPI rose at a 2.3% average annual rate (+2.7% for the three months through September, Chart 4). As of October, this three-month trend in core CPI growth had slowed by 1.4 percentage points compared to its recent peak of 3.8% for the three months through May.
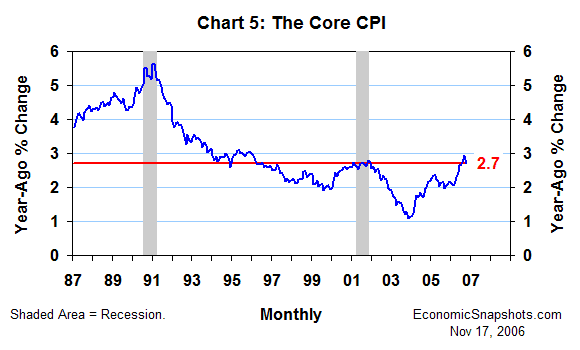
The inflation-wary FOMC is probably feeling cautiously encouraged by this new evidence of slowing core inflation. However, with the broader twelve-month trend in core CPI growth still tracking at an unusually strong 2.7% for the twelve months through October (Chart 5), FOMC members probably won’t be inclined to relax their heightened inflation watch, just yet.
Suzanne Rizzo