| Back to Index |
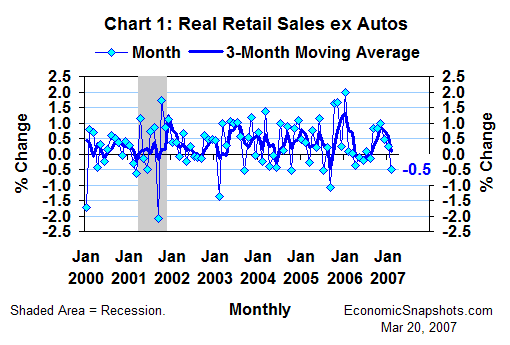
March 20, 2007 – U.S. retail sales excluding autos edged down by 0.1% in February and the CPI for consumer goods rose by 0.4%. Thus, real non-auto retail sales fell by 0.5% in February after a January increase of 0.3% (Chart 1).

Some of this weakness in February non-auto retail sales may have been a temporary aberration caused by that month’s unusually harsh weather.
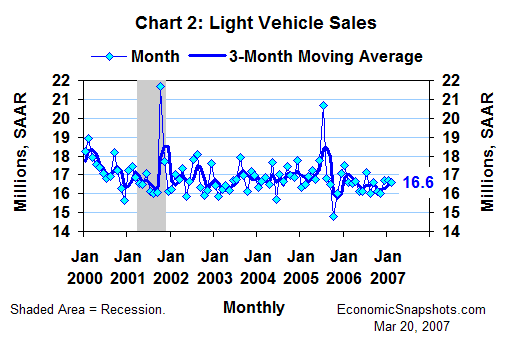
Car and light truck sales were about flat in February, edging down by 0.1M units to a 16.6M unit annual rate (Chart 2).

Thus, total real sales of consumer goods probably fell in February, and probably roughly reversed January’s 0.3% increase. As of Q4, consumer goods accounted for about 40% of U.S. consumption (measured in current dollars).
Growth in consumers’ real services purchases (the remaining 60% of consumption) averaged 0.2% per month for the three months through January. Assuming all else the same, a large weather-related jump in household electricity and natural gas demand should push February services growth slightly above this trend.
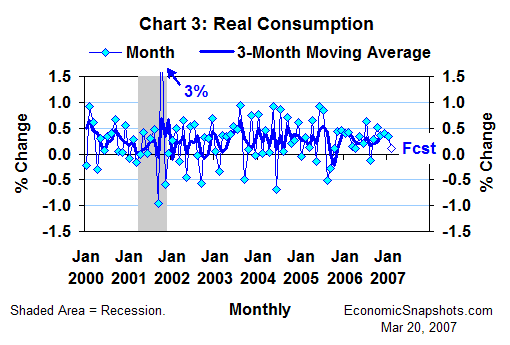
Putting these pieces together, real consumption growth might have slowed to just 0.1% in February after a 0.3% January increase (Chart 3).

That would leave Q1 real consumption growth tracking at a 3.7% annual rate, as of the quarter’s second month. For all of Q4, real consumption rose at a 4.2% annual rate.
Suzanne Rizzo