| Back to Index |
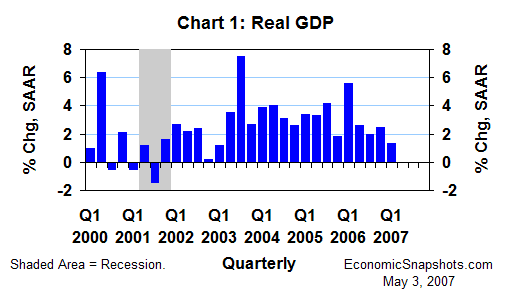
May 3, 2007 – According to data released last week, U.S. real GDP rose at a weak 1.3% annual rate in Q1 following a modest 2.5% gain in Q4 (Chart 1).[1]

In Q1, the major components of real GDP showed continuing brisk real consumption growth (up at a 3.8% annual rate in Q1 after a 4.2% gain in Q4), and relatively weak real growth in everything else.[2]
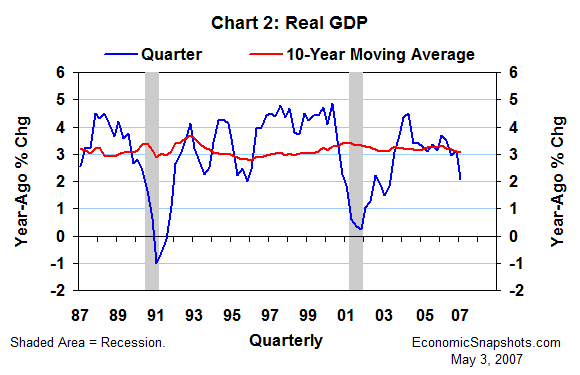
Real GDP rose by 2.1% in Q1, compared to the same quarter last year (Chart 2). That’s a full percentage point less than the 3.1% average annual rate of real GDP growth for the ten years through Q1. For the four quarters through Q4, real GDP growth just matched this ten-year average.

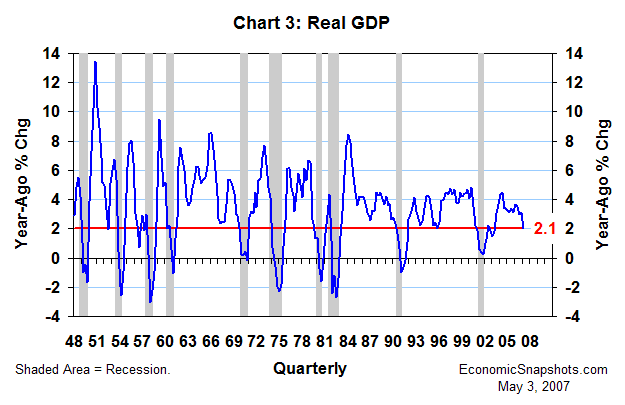
Historically, we have seldom seen real GDP growth this weak except when a recession was near (zero to four quarters away, Chart 3).

In fact, since the start of these data in 1948, there have been only two exceptions to this rule. The first occurred in Q4 1995. That was the nadir of a Fed-engineered “soft landing”. The second occurred in the first two quarters of 2003. At that point, the economy was still caught in the quagmire of the notoriously slow-moving, “job-loss” recovery that followed the 2001 recession.
But, that ancient history may not apply today. If potential real GDP growth has slowed, compared to its historical averages, we should expect to see a slower trend in actual real GDP. (According to economic theory, potential real GDP growth governs the rate of actual real GDP growth, in the long run.)
In particular, we have yet to see a convincing cyclical recovery in the labor force participation rate during the current economic expansion. This non-development has raised suspicions that behavioral changes may have caused a structural slowing in labor force growth. That could cause potential real GDP growth to slow.
In addition, the exodus of retiring baby-boom workers from the labor force will be working to keep labor force growth depressed for the next two or three decades. That could keep potential real GDP growth on a slowing trend.
To date, however, the net size and timing of these demographic changes – as well as their bottom-line implications for potential real GDP growth – remains very uncertain.
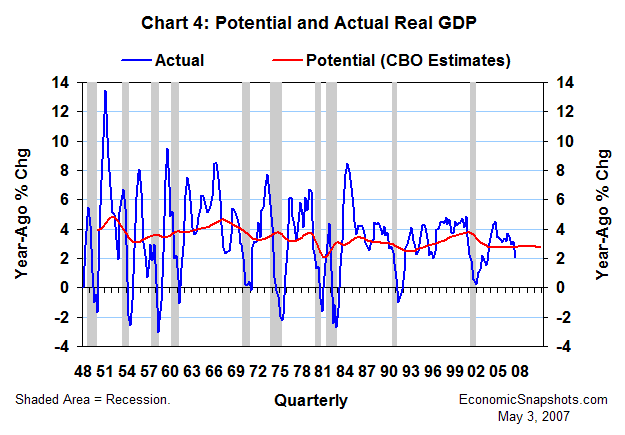
According to the latest quarterly estimates provided by the Congressional Budget Office (CBO), year-ago growth in potential real GDP peaked at 3.8% in Q4 2000 (Chart 4). As of Q1, it had slowed by 1 percentage point to 2.8% (Chart 4).

That’s still 0.7 percentage points more potential real GDP growth than the actual 2.1% increase in real GDP for the four quarters through Q1. Thus, even using this adjusted yardstick, recent rates of real GDP growth still look unusually weak.
Suzanne Rizzo