| Back to Index |
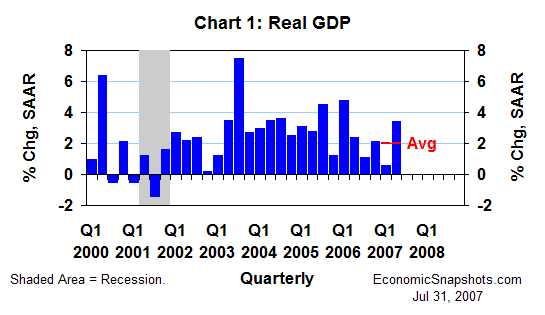
July 31, 2007 – U.S. real GDP (released Friday) rose at a 3.4% annual rate in Q2, after edging up by just 0.6% in Q1 (Chart 1).[1]

This Q2 rebound raised average real GDP growth to a “moderate” 2% annual rate in the first half of this year.
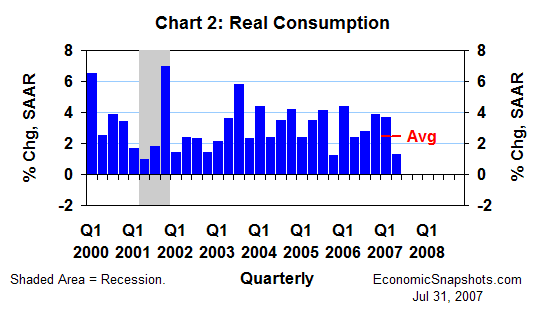
Moving opposite to the pattern of GDP, real consumption growth slowed to a mere 1.3% annual rate in Q2, compared to a 3.7% gain in Q1 (Chart 2).

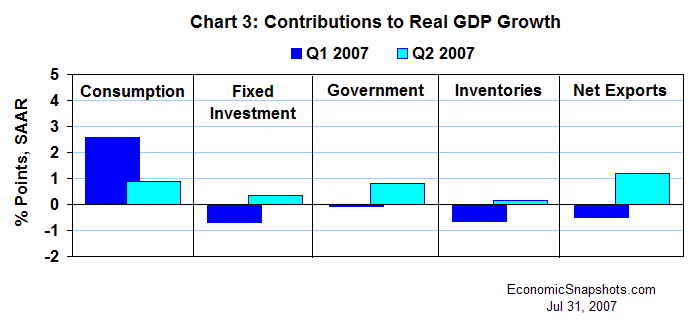
Consumption’s contribution to real GDP growth fell by 1.7 percentage points (pp) to +0.9 pp in Q2 (Chart 3). If the rest of the economy had continued on its Q1 path, real GDP would have fallen in Q2.

But, all of the other major GDP components (fixed investment, government spending, inventories and net exports) saw stronger real growth in Q2. These extra other gains more than offset the effect of slower consumption growth on Q2 real GDP growth.
Looking ahead, the economy would be hard pressed to continue to grow at a “moderate” pace without stronger growth in the heavily-weighted consumer sector than we saw in Q2. (Consumption accounts for slightly more than 70% of U.S. GDP.)
However, as Fed Chairman Bernanke indicated in his semi-annual testimony on U.S. monetary policy, earlier this month, real consumption growth was unsustainably strong in both Q1 and Q4 – at least from the FOMC’s point of view.
Thus, a key question for the outlook is whether the trend in consumption growth will stabilize somewhere between these two extremes – implying somewhat firmer real consumption growth in Q3. Bernanke argued that the “strong” labor market would keep consumption from slowing too much.
Suzanne Rizzo
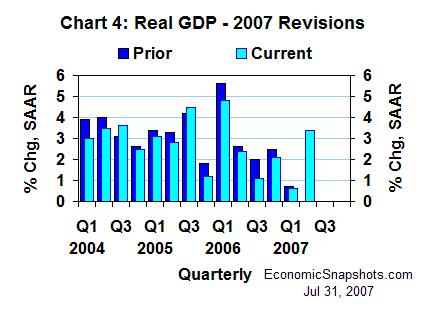
Note: Friday’s GDP release included the BEA’s regular annual revisions, affecting the data from Q1 2004 through Q1 2007.
These revisions reduced real GDP growth in all three years, but caused little change in the quarterly pattern (Chart 4).

In the revised data, real GDP rose at a 2.7% average annual rate between Q4 2003 and Q1 2007. Before revision, this trend was 0.3 percentage points higher at 3%.