| Back to Index |
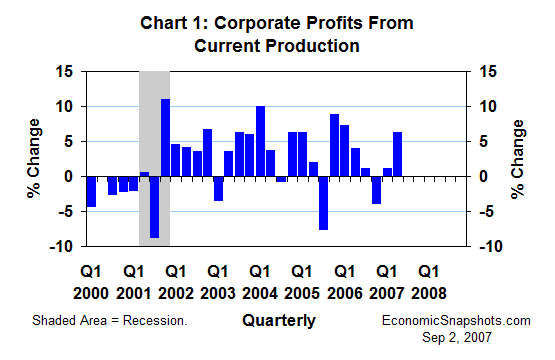
Sep 2, 2007 – In the data news last week, U.S. corporate profits from current production rose by 6.4% in Q2 (not an annual rate) after a smaller 1.1% rise in Q1 (Chart 1).

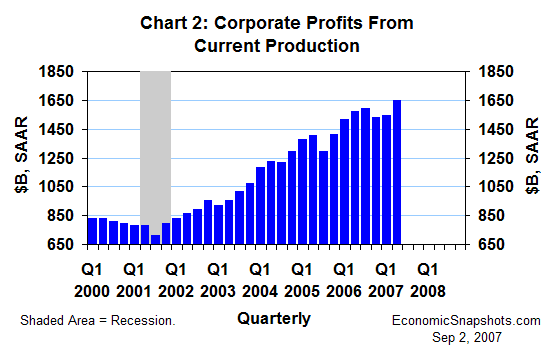
That increase in Q1 profits was too small to fully reverse Q4’s 3.8% decline (Chart 2). But, Q2’s gain put total profits back on a positive trend.

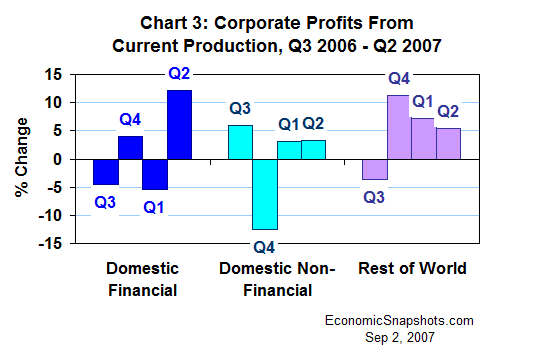
However, all of the acceleration in Q2 profit growth came from a big 12.1% leap in the profits of domestic financial corporations (Chart 3). These financial profits fell by 5.4% in Q1.

Domestic non-financial profits rose by 3.2% in Q2, about matching Q1’s 3.1% increase. As of Q2, these profits had yet to fully recover from Q4’s huge 12.5% decline.
Net foreign profits rose by 5.4% in Q2. That’s good strong growth, although not as strong as Q1’s 7.2% gain.
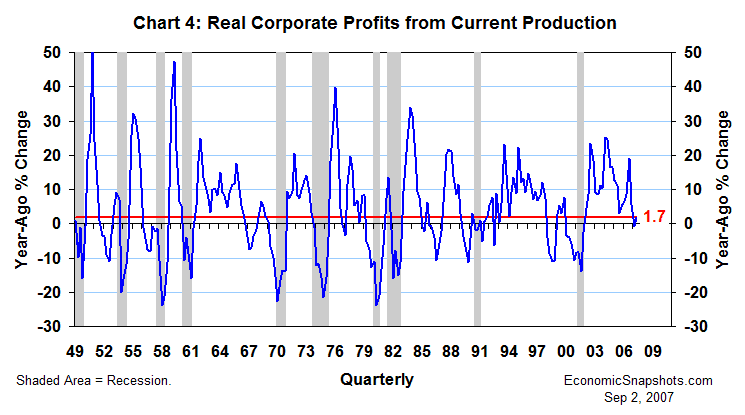
Compared to the same quarter last year, real corporate profits from current production rose by a relatively weak 1.7% (Chart 4).

This four-quarter trend slowed from a 5.5% gain in the four quarters through Q4 to a 0.8% decline in the four quarters through Q1. Growth strengthened a bit in Q2, but not by very much. That big boom in corporate profits since the end of the last recession had clearly lost its forward momentum in Q1 and Q2.
On the other hand, these data are not weak enough, yet, to offer more than a modicum of support for arguments that the next recession might have already begun. If that were the case, we would probably see a much more negative trend in corporate profits than we have so far this year.
Suzanne Rizzo