| Back to Index |
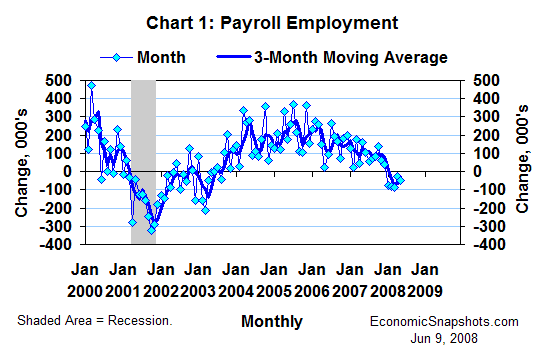
June 9, 2008 – In Friday’s data, U.S. payroll employment edged down by 49K in May after revised declines of 28K in April and 88K in March (Chart 1).

According to the BLS, it takes a monthly decline of at least 104K to qualify as a statistically significant change at the 90% confidence level. Payrolls were essentially unchanged in each of the last three months.
However, the cumulative reductions in payrolls this year do qualify as significant job losses. The economy shed a total of 165K jobs in the last three months and 324K jobs have vanished since December last year.
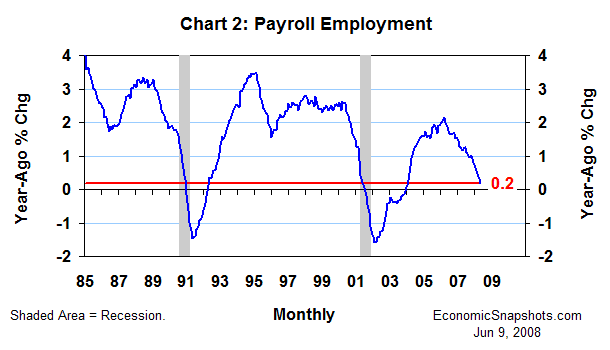
Payrolls edged up by 0.2% in May, compared to the same month last year (Chart 2). This twelve-month trend reached an expansion peak of 2.1% in March 2006.

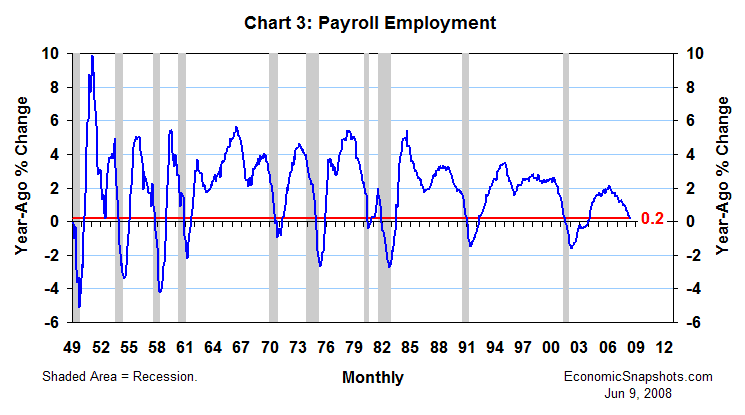
We rarely see such a weak trend in payroll growth except during, or directly after, a recession. The only other exception in the last six decades was the twelve months through July 1952 (Chart 3).

On average for the last 10 recessions, it took 5.7 months of recession to push year-ago payroll growth as low as 0.2%. For the last recession (in 2001) it took three recession months.
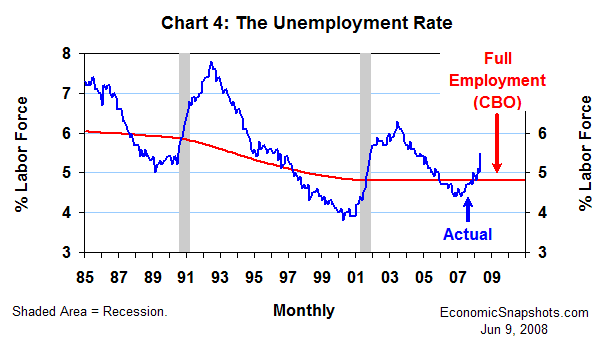
The unemployment rate shot up by a half percentage point to 5.5% in May (Chart 4). That was its largest monthly increase since February 1986.

The May unemployment rate exceeded the Congressional Budget Office’s (CBO) estimate of its “full employment” level by 0.7 percentage points.
As the BLS noted, unemployment rates rose in May for five of the six broad demographic groups (adult men, adult women, teenagers, whites and blacks). (The Latino unemployment rate was unchanged in May.)
However, teens and young adults (ages 16 to 24) accounted for an unusually large portion – just over half – of the total increase in the May unemployment rate.
Developments in these younger age groups are always suspect at this time of year (from April through July), because of chronic seasonal adjustment problems related to the winding down of the school year and large flows of students into the labor force. Thus, up to 0.3 percentage points of the increase in the May unemployment rate might have been a statistical fluke.
Even so, excluding the effects of these younger age groups, the unemployment rate still rose by a fairly substantial 0.2 percentage points in May.
Bottom line: labor demand continued to weaken in May.
Suzanne Rizzo