| Back to Index |
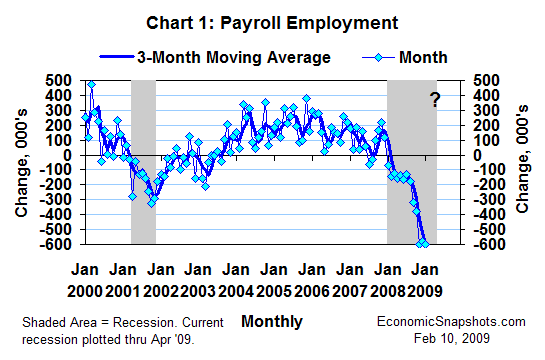
February 10, 2009 – In Friday’s data, U.S. payroll employment fell by 598K in January, reflecting broadly-based weakness (Chart 1).

January marked the third straight month of truly extraordinary job losses. For the three months through January, payrolls fell by an average of 591K per month.
These data suggest that the recession was still going strong in January. That would be its 13th month.
There have been ten other recessions in the last 60 years, with an average length of 10 months. This recession reached that average length in October.
The two longest of these historical recessions both lasted 16 months. (These are the 1981-82 recession and the 1973-75 recession.) This recession might match that record if it continues through April.
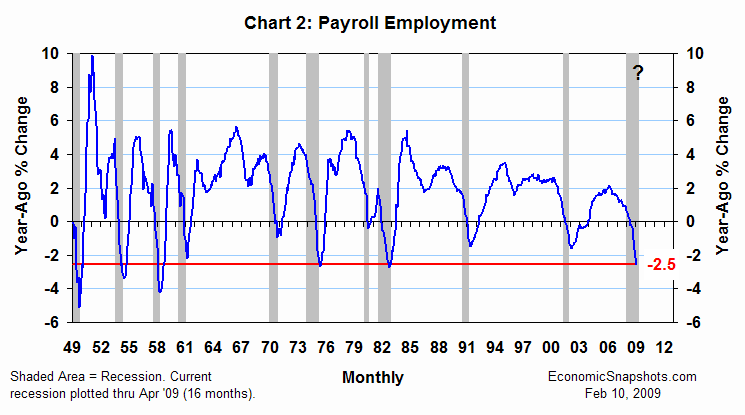
Payrolls fell by 2.5% in January, compared to the same month last year (Chart 2).

That was the largest 12-month payroll decline since September, October and November, 1982. Those were the last three months of the 1981-82 recession.
That raises an interesting point. Payroll employment is a coincident economic indicator. Payroll growth tends to be at its weakest when the economy is close to a recession trough (the last month of a recession).
Thus, this distressingly weak growth in payroll jobs does not necessarily mean that the recession will last for many more months.
Suzanne Rizzo