| Back to Index |
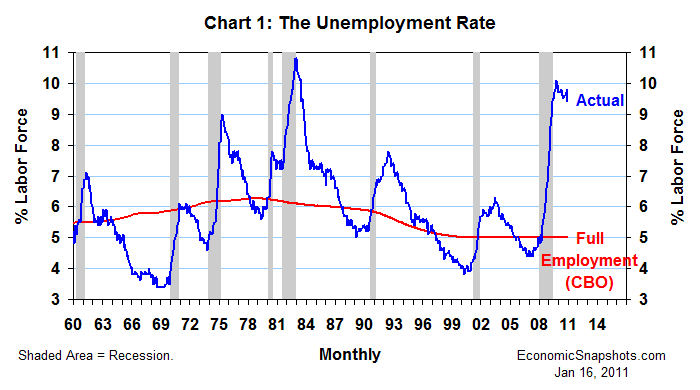
January 16, 2011 – In data released earlier this month, the U.S. unemployment rate fell by 0.4 percentage points to 9.4% in December (Chart 1).

That was the unemployment rate’s largest monthly drop since April 1998, when it fell by 0.4 percentage points to 4.3%.
However, December’s reduction is less impressive than that earlier episode, in part because the unemployment rate is so much higher now.
According to August estimates from the Congressional Budget Office, the unemployment rate’s so-called “natural” or “full-employment” level is currently 5%. Even after its December plunge, the actual unemployment rate continued to exceed this full-employment level by a massive 4.4 percentage points.
Further, actual job growth accounted for only about half (297K) of December’s 557K decrease in the number of unemployed. The other 260K simply vanished from the labor force. (The labor force participation rate fell by 0.2 percentage points in December to 64.3%.)
Thus, roughly half of the reduction in the December unemployment rate stemmed from the fact that fewer people were looking for work that month.[1] That is not what one would typically expect to see in a strengthening labor market.
Thus, the unusually large decline in December’s unemployment rate appears to overstate the true underlying improvement in U.S. labor demand.
Suzanne Rizzo